Solar before summer: what a small 3 kW system pays back at today's tariffs
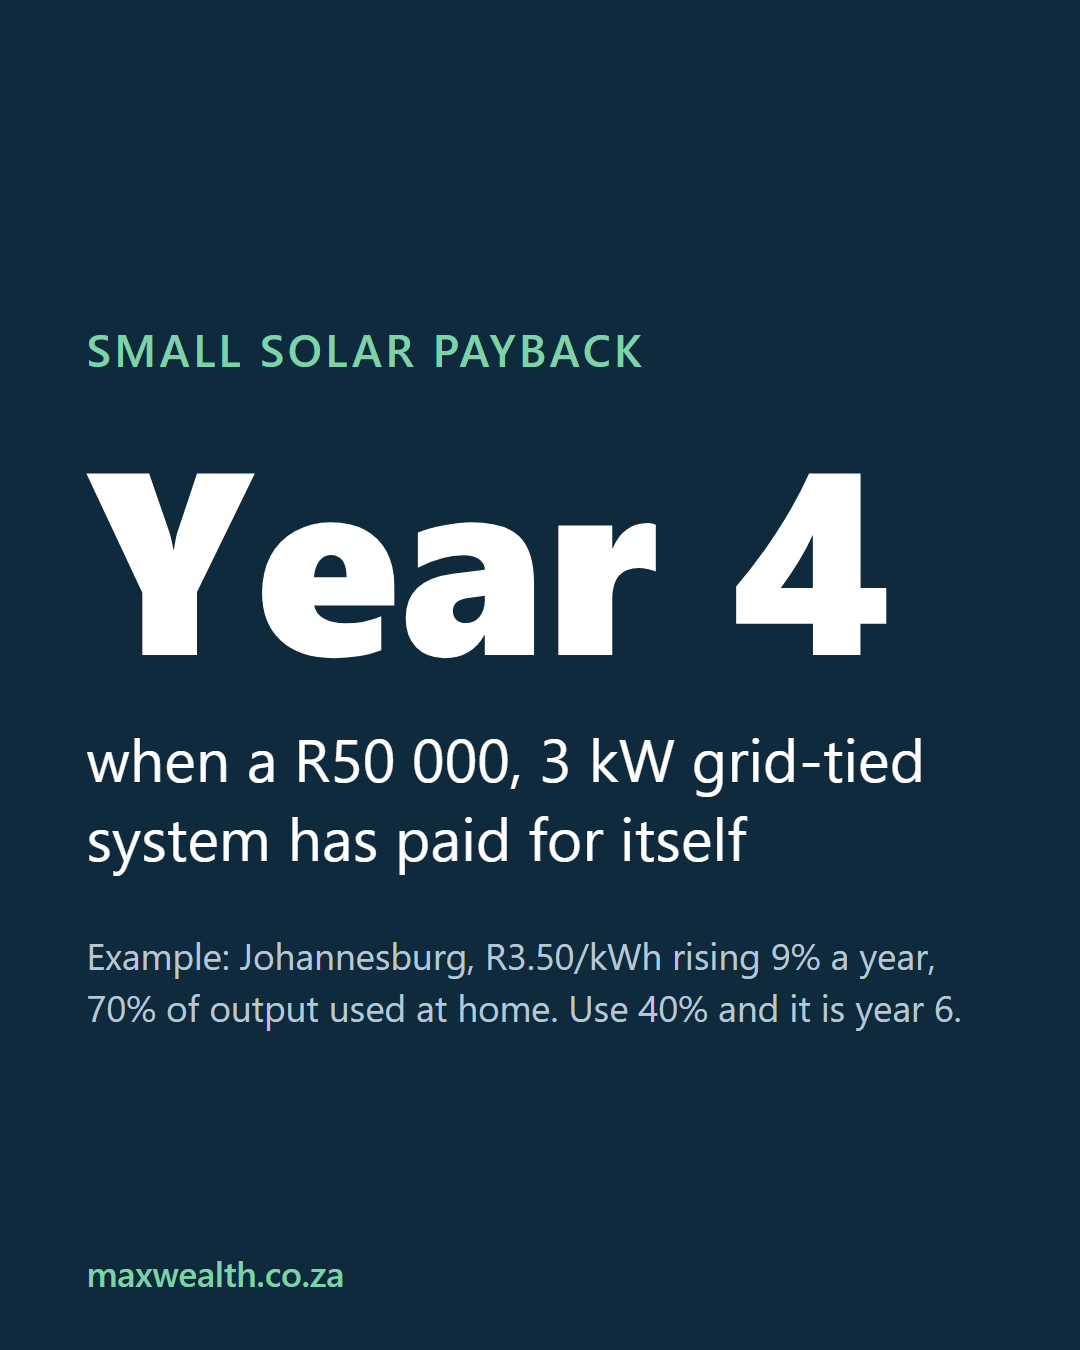
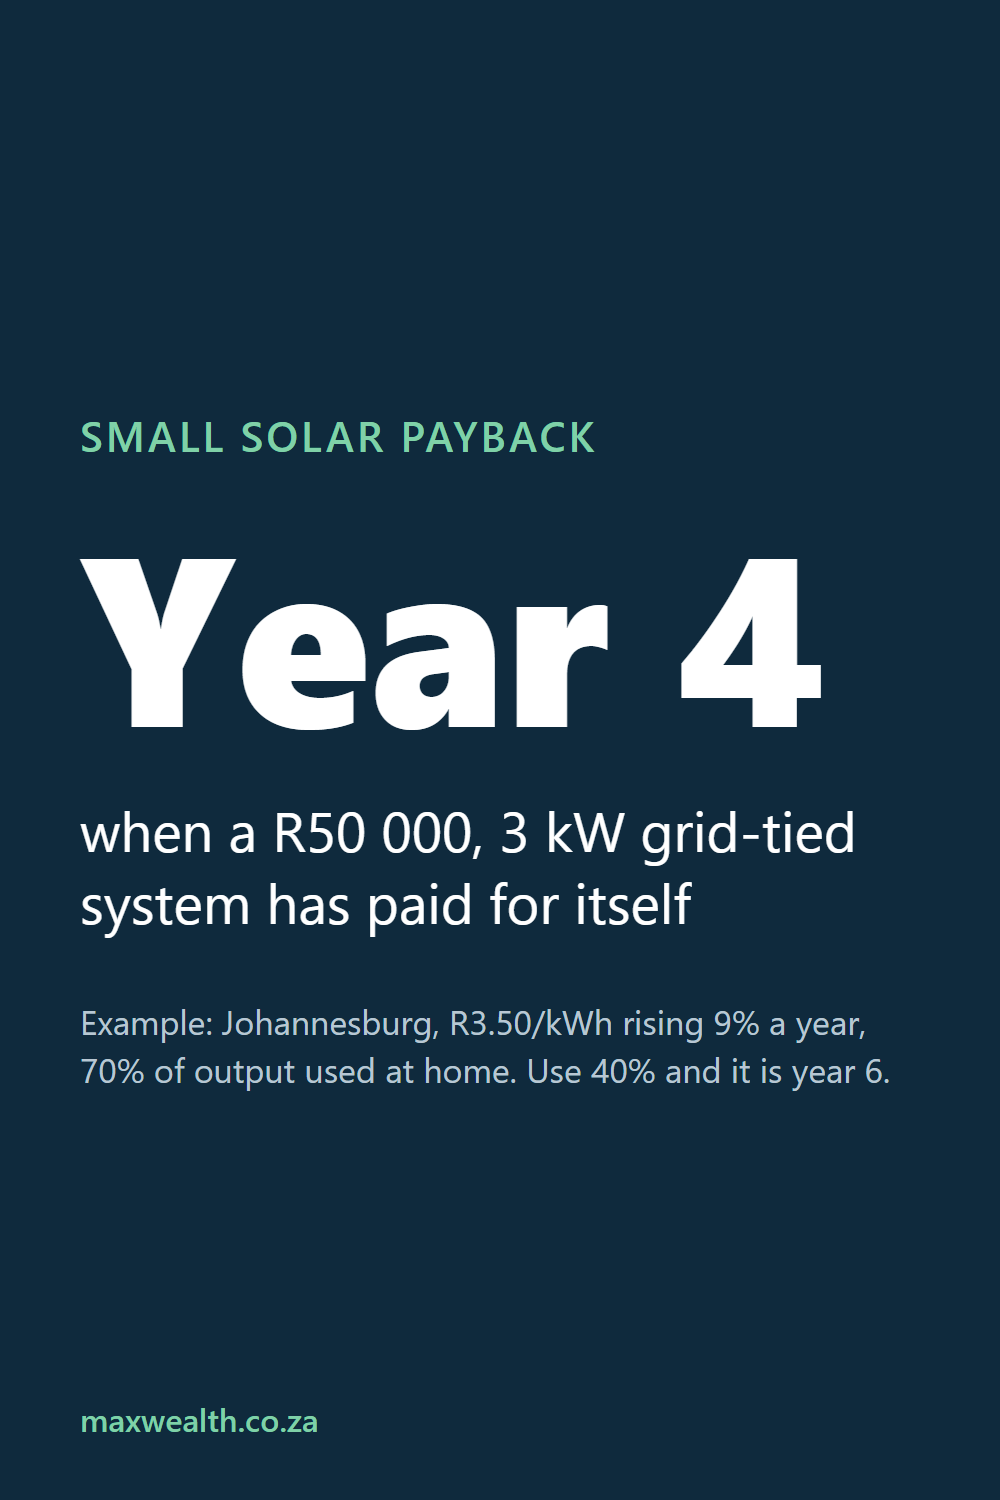
At R3.50 a kWh and 9% a year price increases, a R50 000 grid-tied 3 kW system in Johannesburg pays for itself in its 4th year, but only if you use about 70% of what it makes at home.
In 30 seconds
- A R50 000, 3 kW grid-tied system pays for itself in year 4 in our Johannesburg example - it saves about R1 073 in its first month at R3.50 a kWh.
- How much you use at home matters more than the tariff increase - use 40% of the output instead of 70% and payback slips from year 4 to year 6.
- On a 5-year loan at 10.75%, the repayment is R1 081 a month - roughly what the system saves in year 1, so it can pay its own way from the start.
Summer is when solar looks its best: long days, high sun and an electricity bill that went up by an average of 9.01% for municipal customers on 1 July 2026. It is also when installers are busiest and when it is easiest to buy on enthusiasm.
This post does the sums the slow way for a small system: about 3 kW of panels, the size a household chooses when it wants to cut the daytime bill rather than leave the grid. We work through what it makes, how much of that you actually use, what each kWh is worth, and how long it takes to earn back its price. Then we change one thing at a time to see which assumptions really move the answer.
Every figure below is either sourced or labelled as our own estimate. Your own quote and your own bill will beat all of them.
What "small" means here
A 3 kW system is about five or six modern panels on a roof, an inverter that turns their output into household power, and the wiring and mounting to hold it together. Installer price guides put the installed price of a grid-tied system with no battery at R45 000 to R90 000, and a 3 kW system with a 5 kWh battery at R55 000 to R80 000 (market ranges published in 2026).
We use two worked examples throughout:
- Example A: 3 kW grid-tied, no battery, R50 000 installed. It only saves money while the sun is up. In a power cut it switches off for safety.
- Example B: 3 kW with a 5 kWh battery, R67 500 installed. The midpoint of the published range. The battery stores some of the midday output for the evening and keeps the lights and Wi-Fi on in an outage.
Both prices are our choice within published market ranges, not quotes. Prices vary by roof, region, brand and installer, and panel prices have fallen sharply since 2023, so get at least three written quotes.
The three numbers that decide payback
Strip away the jargon and a solar system's payback depends on three things:
- What it costs - the installed price, plus anything you will have to replace before the panels are done.
- How many kWh it saves you - not how many it makes. Power you make but cannot use at the moment it is made is worth very little on most South African tariffs.
- What each saved kWh is worth - your tariff today, and how fast it rises.
Payback is simply the year in which the money you did not pay for electricity adds up to more than the price of the system. After that, every kWh is profit until something needs replacing.
Step 1: what 3 kW of panels makes
The European Commission's PVGIS model uses satellite data from 2005 to 2020 to estimate how much a system makes in a given place. With panels tilted at 30 degrees facing north and 14% allowed for losses, PVGIS gives these yearly averages per kW of panels:
| City | kWh a day per kW | 3 kW system, kWh a year |
|---|---|---|
| Bloemfontein | 5.0 | 5 475 |
| Johannesburg | 4.8 | 5 256 |
| Cape Town | 4.6 | 5 037 |
| Gqeberha | 4.4 | 4 818 |
| Durban | 4.1 | 4 490 |
That is already the year-round average, so it includes winter's short days and summer's cloud. The gap between the sunniest and the cloudiest city on the list is about 18%. Location matters, but as you will see below, it matters less than how you use the power.
Panels also lose a little output every year. We assume 0.5% a year, which is in line with the performance warranties most panel makers publish; it means a system makes about 89% of its first-year output in year 25.
The 0.5% a year degradation is a general industry figure, not one measured in South Africa. Check the performance warranty on the panels you are quoted.
Step 2: how much of it you actually use
This is the number most quotes skip, and it is the one that matters most.
A grid-tied system without a battery feeds your house first. If the house is using less than the panels are making at that moment, the surplus either goes back to the grid or is throttled off. Most South African municipalities either do not pay for power exported to the grid or pay a fraction of what they charge, and you usually have to register the system and sometimes change your meter before you are allowed to export at all.
So the useful question is: what share of the output happens while something in the house is switched on? That share is called self-consumption.
- Someone home during the day, a geyser on a timer set for midday, a pool pump run in the morning, washing and dishwashing done in daylight: 70% or more is realistic.
- Everyone out from 7 to 6, geyser heating overnight, washing done in the evening: 40% or lower is common.
- A battery lifts it, because midday surplus is stored for the evening. We use 85% for Example B.
The 70%, 40% and 85% self-consumption figures are our estimates for illustration, not measured South African averages. A smart meter or your installer's monitoring app will show your real figure within a month.
In Johannesburg, that turns Example A's 5 256 kWh a year into 3 679 kWh actually saved at 70%, and only 2 102 kWh at 40%. Example B, at 85%, saves 4 468 kWh.
Step 3: what each saved kWh is worth
Municipal tariffs vary widely - by city, by how much you use (many use rising blocks) and by whether you are prepaid or on a fixed-plus-energy plan. Our worked examples use R3.50 a kWh, the starting point of the MaxWealth solar calculator for a typical municipal household.
R3.50 a kWh is our estimate of a typical municipal rate for a household using about 600 kWh a month, not a published average. Divide your last bill's energy charge (not the fixed charges) by the kWh on it to get your own figure.
Then the increases. In March 2026, NERSA corrected an error in its earlier Eskom decision and approved higher increases for 2026/27: 8.76% for Eskom's direct customers from 1 April 2026 and 9.01% for municipal customers from 1 July 2026, after 12.74% in 2025/26. The original path for 2026 to 2028 had been 5.36% and 6.19%.
Nobody knows what the next 25 years hold, so we run three paths:
- Low: 6% a year - roughly the original NERSA path.
- Moderate: 9% a year - roughly this year's municipal increase. Our main case.
- High: 13% a year - roughly the 2025/26 increase, sustained.
Example A: the grid-tied 3 kW system, year by year
Johannesburg, R50 000 installed, 70% used at home, R3.50 a kWh rising 9% a year, panels losing 0.5% a year:
| Year | Saved that year | Saved in total | Still to earn back |
|---|---|---|---|
| 1 | R12 877 | R12 877 | R37 123 |
| 2 | R13 966 | R26 843 | R23 157 |
| 3 | R15 147 | R41 990 | R8 010 |
| 4 | R16 427 | R58 417 | paid back |
| 5 | R17 816 | R76 233 | R26 233 ahead |
That first-year saving is about R1 073 a month. The system pays for itself during its fourth year and, on the moderate path, saves about R1.0 million over 25 years - most of it in the later years, when the tariff has compounded.
That last number deserves a pinch of salt. It is the sum of 25 years of rising tariffs, and it assumes you stay in the house, the tariff structure stays recognisable and the system keeps working. The early years are the solid part of the case; treat the 25-year total as an illustration of direction, not a promise.
Example B: add a 5 kWh battery
The battery costs more up front - R67 500 against R50 000 in our examples - but it lets you use more of what the panels make. At 85% self-consumption the same 3 kW of panels saves 4 468 kWh a year, worth R15 637 in year 1, or about R1 303 a month.
| Year | Saved that year | Saved in total | Still to earn back |
|---|---|---|---|
| 1 | R15 637 | R15 637 | R51 863 |
| 2 | R16 959 | R32 596 | R34 904 |
| 3 | R18 393 | R50 989 | R16 511 |
| 4 | R19 948 | R70 937 | paid back |
Payback also lands in year 4, because the extra saving roughly keeps pace with the extra cost. The difference is what you get on top: backup power during outages, which is worth something real to a household that works from home, and which this calculation does not price at all.
The catch is that lithium batteries wear out faster than panels. We assume a R20 000 battery replacement in year 11. Even with that, the moderate path ends 25 years about R1.13 million ahead in total savings - but again, the early years are the part to lean on.
The 10-year battery life and the R20 000 replacement cost are our estimates. Battery warranties are usually written in years and in charge cycles; check both on your quote, and expect battery prices to keep moving.
What actually moves the payback
Here is Example A again, changing one input at a time and leaving the rest at our main case (Johannesburg, R3.50, 9%, 70%):
| Change | Year-1 saving | Pays back in |
|---|---|---|
| Main case | R12 877 | year 4 |
| Only 40% used at home | R7 357 | year 6 |
| Tariff R2.50 a kWh | R9 198 | year 5 |
| Tariff R4.50 a kWh | R16 556 | year 3 |
| Durban instead of Johannesburg | R10 999 | year 5 |
| Bloemfontein instead of Johannesburg | R13 414 | year 4 |
| Prices rise 6% a year, not 9% | R12 877 | year 4 |
| Prices never rise at all | R12 877 | year 4 |
Three things stand out.
Self-consumption is the biggest lever you control. Moving the geyser timer, the pool pump and the washing into daylight costs nothing and can take two years off the payback. It is also the one assumption a salesperson is least likely to ask about.
The tariff increase barely moves a short payback. Over four years, the difference between 6% and 9% a year is small; it is the 25-year total that changes enormously (about R656 000 on the low path against R1.0 million on the moderate one). Even if electricity never got dearer, the R50 000 system would still earn itself back in its fourth year at R3.50 a kWh. A system whose case depends on high future increases is a weaker case.
Your starting tariff matters more than your city. R2.50 against R4.50 a kWh is the difference between year 5 and year 3. That is why the first thing to do is look at your own bill, not at national averages.
Cash or a loan?
If you finance the system, the comparison becomes monthly: does the saving cover the repayment?
At prime, which has been 10.75% since the Reserve Bank's 25-basis-point hike in September 2026, a 5-year loan works out like this (our calculation, standard amortising loan, no fees):
| Example A (R50 000) | Example B (R67 500) | |
|---|---|---|
| Monthly repayment | R1 081 | R1 459 |
| Total repaid over 5 years | R64 854 | R87 553 |
| Saving in month 1 | about R1 073 | about R1 303 |
| Savings over the 5 years | R76 233 | R92 571 |
| Ahead after 5 years | R11 379 | R5 018 |
For Example A, the repayment and the first-year saving are within a few rand of each other, and from year 2 the saving is larger. Example B runs about R156 a month short in year 1 and catches up as the tariff rises. In both cases the loan more or less pays for itself, but the interest eats most of the first five years' gain - and only if your real self-consumption matches the example.
Two cautions. Banks often lend for solar above prime, and adding it to a home loan stretches the repayment over 20 years, where the total interest is far higher even though the monthly figure looks small. Ask for the total cost of credit, not just the instalment.
Against leaving the money in the bank
The fair test of a cash purchase is what the same money would have done elsewhere. R50 000 earning 7.25% a year - roughly the repo rate after the September 2026 hike, and close to what money-market funds pay - grows to about R287 700 in 25 years before tax.
On the moderate path, Example A's savings add up to about R1.0 million over the same 25 years, before you even invest them. Even with no tariff increases at all, the savings total about R303 000. On these assumptions, a small, well-used system beats cash in the bank comfortably. The case only weakens when self-consumption is low, the tariff is cheap, or you expect to sell the house within a few years.
Interest earned in the bank is taxable above the annual interest exemption, while electricity you do not buy is not taxed, which tilts the comparison further towards solar. We have not modelled tax here.
Why "before summer" - and why not to rush
Installing in October or November means the system's first months are its most productive: long days and a high sun. On an annual payback that is a small head start, not a reason to sign a contract this week.
Against it: summer is also peak season for installers, so lead times stretch and there is less room to negotiate. In summer-rainfall areas such as Gauteng, afternoon storms cut output on many days, which the annual PVGIS figures already include. If a quote arrives with a "this month only" price, that is pressure, not a reason.
The costs people forget
- Registration and compliance. Most municipalities require a grid-tied system to be registered, with an electrical certificate of compliance, and some require a meter change before you may export. Unregistered systems can be fined or disconnected.
- Fixed charges. Some municipalities have moved more of the bill into fixed monthly charges that do not fall when you use less power, and some charge solar households a separate fee. Solar only saves the energy part of your bill.
- The inverter. Inverters usually last less long than panels; budget for one replacement over 25 years.
- Insurance. Panels on the roof may need to be added to your buildings insurance, and the premium may rise.
- Cleaning. Dust and bird droppings cut output; panels in dry, dusty areas need cleaning a few times a year.
We did not price fixed charges, solar fees, inverter replacement, insurance or cleaning, because they vary too much by municipality and installer. Each one stretches the payback a little; check your municipality's current tariff schedule for solar or small-scale embedded generation charges before you sign.
A checklist for any quote
- Work out your own tariff from your last bill: energy charge divided by kWh.
- Look at your daytime use - what is on between 9 and 3 on a weekday? That decides self-consumption.
- Ask the installer for a yearly kWh estimate for your roof and compare it with the PVGIS figure for your city above.
- Get three written quotes for the same size system, with the panel, inverter and battery warranties in writing.
- Ask about registration with your municipality and who handles the paperwork and certificate.
- If financing, compare the total cost of credit, not the monthly instalment.
- Put your own numbers into a calculator before you sign, and change self-consumption first.
What this does not tell you
Payback is a money measure. It ignores the value of keeping the lights on during an outage, the value of not worrying about the next tariff decision, and the effect on the price of your house when you sell. Those are real, and they are personal, so they are yours to weigh.
It also assumes you stay. If you are likely to move within four or five years, the system probably will not have paid for itself before you go, and buyers rarely pay full price for a second-hand installation.
Finally, it assumes the system is sized to the house. A bigger system is cheaper per kW, which makes it tempting to buy more panels than you need, but every extra kW you cannot use during the day is money on the roof that earns nothing. For a small system, the cheapest kWh is the one you would have bought anyway, at the time of day the panels make it. Start from your daytime use, size the panels to match it, and add more later only if your monitoring shows the house is still pulling power from the grid while the sun is up.
How MaxWealth helps
The solar calculator runs this same year-by-year sum with your own quote, bill and tariff: it shows the break-even year, the net gain after 20 and 25 years, cash against a loan, and the effect of a battery, with low, moderate and high price-increase paths. Every input is a slider and nothing is saved.
Sources
- Electricity increases for 2026/27 - 8.76% for Eskom direct customers from 1 April 2026, 9.01% for municipalities from 1 July 2026: Eskom - Eskom implements NERSA decision for financial year 2027.
- NERSA's correction after the R54.7 billion error, the 12.74% 2025/26 increase and the original 5.36% and 6.19% path: Engineering News, 10 March 2026.
- Solar output per kW by city (satellite data 2005-2020, 30 degrees, north-facing, 14% losses): European Commission JRC - PVGIS 5.2.
- Installed price ranges for grid-tied and small battery systems in 2026: EnergyBee - Cost of a home solar system in South Africa, 2026 (installer price guide; market ranges).
- Repo rate 7.25% after the 25-basis-point hike of 23 September 2026: Trading Economics, September 2026. Prime 10.75%: Briefly News, September 2026.
- Worked examples, loan repayments and the comparison with cash: our own calculation. Tariff, self-consumption, degradation and battery figures are our estimates, labelled where used.
Education, not financial advice. This post explains how the rules and the arithmetic work. It does not recommend any financial product, and your own situation may differ - speak to a registered financial adviser or tax practitioner before you act. Figures were checked against the linked sources on the date above.